A Methodology for the Assessment
of the Gross National Land Value
of Mainland Britain
F. J. Jones
[Reprinted from Land & Liberty, Autumn
1975]
THE PRINCIPAL PROBLEM associated with the assessment of land values
in the UK is that official statistics dealing with the subject
normally use global property values which combine the value of land
with that of buildings. Thus a method has to be devised for separating
these two factors which must, if a proper economic analysis is to be
conducted, always be considered as distinct. Furthermore, there are
three broad categories of land to be taken into account: agricultural
land, housing land, and industrial and commercial land.
Agricultural land offers no special difficulties of assessment
because in this case alone Inland Revenue Statistics distinguish farm
land from farm buildings and produce two separate lists of values. On
the other hand, the problems associated with the areas of housing, and
with industrial and commercial land have in the past proved
progressively more difficult to deal with because these categories are
calculated exclusively in the form of composite land and building
assessments.
However, with housing land a hitherto unsuspected shortcut to an
approximate estimate of land value for the whole of mainland Britain
is now available, since new 'domestic' land sites are valued annually
on what amounts to a sample basis. Similarly, the annual average
density of housebuilding is provided, so that the average price per
plot can be calculated once we know the number of houses in existence.
Consequently, if we presuppose that the range of new buildings
provides the same variety of land values as the range of land for
older buildings, the regular updating of housing land values is simply
a matter of multiplying annual average plot prices by the total number
of houses.
If this seems over-simplistic, certain powerful checks are available.
The Land Registry Quarterly Report provides an average cost of houses
in England and Wales. We can therefore check the extra costs of labour
and materials each year which is also provided and make an allowance
for inflation. Then we have simply to deduct this regularly updated
average building cost per house from the cost of an average house on
the market, and land value per house per year is left as a residue.
It is also possible to carry out the same operation with mortgage
data. These figures are supplied by the Building Societies and
published in the Stationery Office's Housing and Construction reports.
They provide a range of average house prices in just the same way as
the Land Registry but, significantly, they are based on different
sources. Moreover, an annual index of price variations for development
land for housing also appears in the Housing & Construction data.
It extends from 1982 to 1992 in the most recent issue. So by applying
these indices to the base year's value we can obtain an incremental
increase or decrease in land prices year by year. In this way the
movement of land prices is dynamized and a picture of trends provided
over time.
The problems associated with industrial and commercial land are much
more complex. All that we have available in a comprehensive form are
the non-domestic rating figures, but these fortunately include a
global total for all the non-domestic rates levied annually in the UK.
The major problem is once again to separate land rents from building
returns.
Many types of supportive figures are also floated in commercial
publications, ranging from costs per square metre in commercial
centres for shops and offices to the prices of single or multiple
industrial sites; but these are neither comprehensive enough nor
sufficiently uncontaminated by capital returns on buildings to provide
anything like an overall picture.
HOWEVER, IT IS theoretically justifiable to apply, at least
temporarily, the housing land index to non-domestic rates, and this in
two ways: first in the manner in which it is applied to housing to
update land values annually from a fixed base; and second, in a global
sense to equate the proportion of land to buildings in the
non-domestic field with the known annual ratios for housing. In short,
the ratio of land value to building value in both cases should in a
free market be strictly proportional; and, granted the
disproportionate number of offices and warehouses to industrial
buildings even in the non-domestic area, the gap between the two
ratios should not be very wide. Hence our formula is that non-domestic
land values as a proportion of capitalized non-domestic rates are
broadly equal or proportionate to housing land values as a proportion
of global domestic property values.
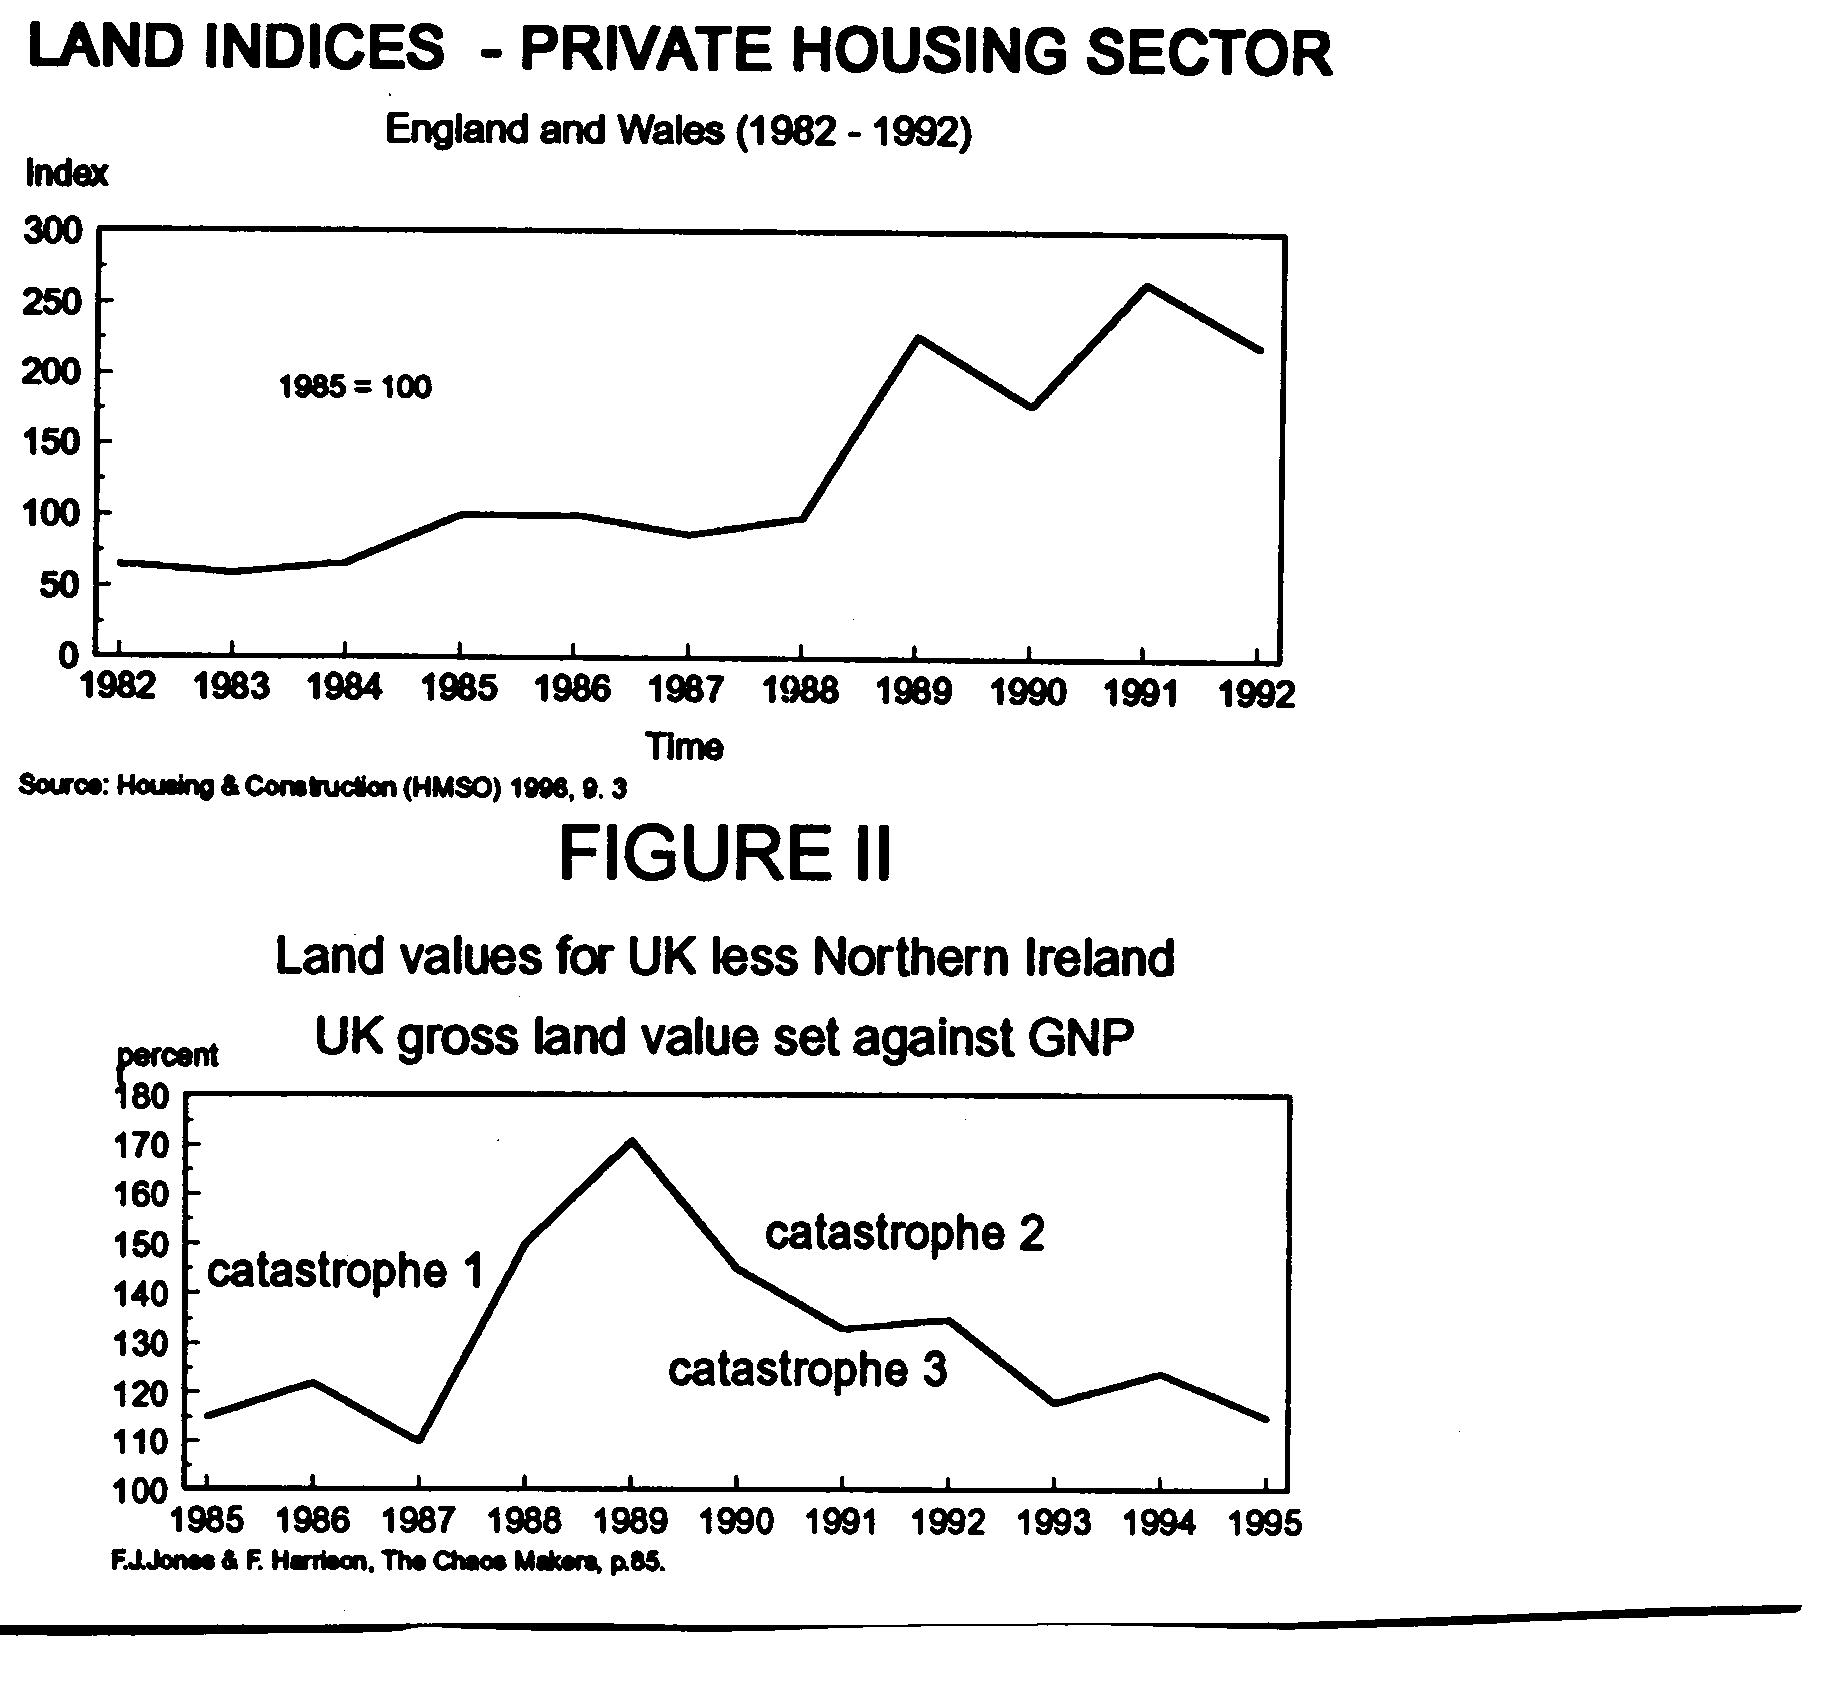
I SHALL PUT forward here two slightly varying methodologies for
producing the necessary non-domestic statistics. The first is the one
adumbrated above, namely, that once we are in possession of an initial
total valuation either in rental or capitalized terms from the
non-domestic rate assessments, we could run the indexed slide-rule for
housing over these calculations and still produce reasonably
satisfactory results. The graph of the index of land values for
housing in England and Wales is given in figure 1.
Following our earlier explained methodology for housing land
assessments, such a guideline clearly offers us a way of revaluing all
housing land annually in retrospect. There is, however, one proviso:
it is that the cost of land on the open market is assumed to be the
same as all other land already utilised in the same way for housing
purposes in the past. This proviso seems to be a reasonable assumption
in free-market conditions for all land, whether domestic or
non-domestic in its zoning.
Let us now revert to our approach to the industrial and commercial
sectors set out earlier. The only sure figures that we have about the
sector is, we recall, the global value of non-domestic rates and their
capitalization as total land and building values. However, even using
official industrial and commercial statistics alone, we can go
somewhat further than this, because we have the range of categories
and numbers of non-domestic buildings in them which the global data
cover. We also have the total amount of rates obtained from each
category, such as shops, offices, warehouses, leisure centres etc. If
the highest rates are levied on the most valuable sites, a scale can
be devised for all other relative land values, with the highest
categories occupying the prime sites and so on down the scale. By
applying such a scale, the following tentative figures representing
proportions of land value to building value in the non-domestic field
emerge: shops 60%, offices 40%, factories 40%, warehouses 30%;
miscellaneous (other) 30%. From these figures a global but non-indexed
estimate can be deduced of non-domestic land values, though the
results cannot pretend to be as accurate as those of the housing
market. For this reason the first method will be adopted in all future
calculations, although our second graph to be presented later is based
on earlier results calculated by the second method.
Finally some additional areas of non-domestic rating for industry and
communications have also proved difficult. For North Sea oil and
gas-fields I have been forced to rely on the rather derisory figures
gained from government royalties and taxes. Likewise for roads I have
had to accept the equally derisory revenue from vehicle road licences.
In both these areas there is therefore a significant shortfall in
potential land value. The same can be said for some other minerals
besides oil; but, on the other hand, quarries, mines, railways and
other similar enterprises are included in non-domestic rates.
The results of this unavoidable indirect approach are perhaps at best
approximate, yet they nevertheless reveal the explosive nature of the
land-value graphs which derive from them. They show that capitalist
economies all have similar disruptive 'tigers in their tanks' due to
the speculative land values which lurk beneath the surfaces of their
economies. For the most part these disruptive forces which inevitably
trigger periodic booms and slumps -- are concealed from view in the UK
by being subsumed under the innocuous subhead of property values. The
almost steady-state facade which results is thus falsely reassuring,
and it so reduces the impact of the land cycle that for much of the
time it hardly seems to exist.
I have measured the worldwide effect of the land cycle on selected
capitalist economies in a recent book, The Chaos Makers
(Othila Press, 1997), written in collaboration with Fred Harrison. It
compares the annual ratios of land-value fluctuations with the
parallel fluctuations of the corresponding figures for GNP in all the
sampled economies. These ratios imply the existence of dramatic
fluctuations in investment in all cases, sometimes resulting in large
swings towards land speculation at the expense of industry and
commerce and at other times in similar swings towards productive
industry at the expense of land values.
Such swings act as a barometer for the prediction of booms and slumps
because they reveal crisis points emerging periodically as gross
imbalances in investment trends. Moreover, the swings towards higher
land prices are accompanied by rises in interest rates, because they
occur at a phase in the cycle in which profits from prolonged
speculative dealings in land become widespread. The reason for this is
that speculative land-fever leads to an increased demand for
speculative investment capital to fuel it, thereby depriving the
entrepreneur of reasonably-priced development capital. As a result,
capitalist economies periodically decline into deep recessions,
through a relative lack of productive demand. This demand is replaced
by a plethora of passive demand bidding up the value of real estate.
By means of catastrophe theory (a mathematical method of delineating
discontinuous processes) it can be demonstrated that these swings are
inevitable unless an annual land-tax is applied as a type of governor
to control the economic machine. Figure 2 compares the ratios of gross
land-values for mainland UK with GNP. In interpreting it, one should,
however, bear in mind that both booms and slumps are regarded as
catastrophes since they are equally disruptive.
The additional parameter of a tax on the full annual economic values
of land spread over the entire economy in these situations would
according to the prescriptions of catastrophe theory rapidly restore
the normal equilibrium between land and entrepreneurial investment and
pave the way for a progressive economic system to emerge. Such a tax
would thus have eliminated in the present instance the prolonged slump
of the early nineties. Furthermore, if the tax were permanently levied
as a principal feature of fiscal policy, it would ensure that the
economy would no longer be troubled by slumps. It would undergo only
the relatively minor dislocations occurring when major new techniques,
such as the computer revolution, appear on the market and replace
preceding technologies. However, after a short period of re-adjustment
these innovations tend to produce far more jobs than those that have
previously been lost.
|